
It is inevitable. At some point when running a WordPress site you will have a conflict, an error, or worst case – a PHP Fatal leading to a WSOD (White Screen of Death).
My goal is to provide the means with which you should be able to view and hopefully understand, to some degree, the errors so that the most appropriate person can provide a solution.
Why is it Inevitable?
By virtue of the shear number of different WordPress plugins, themes, and PHP versions, there are bound to be interactions that cause issues. Hopefully these issues don’t bring down your site. But some will.
Types of Errors
There are a few basic types of errors common to WordPress sites. Primarily all are PHP errors. There are 3 primary types of PHP errors: PHP Fatal, PHP Warning, and PHP Notice.
Under most circumstances you might not even be aware of either the PHP Warning or PHP Notice errors as they commonly only display in your PHP error log. A PHP Fatal error is the most common cause of the WSOD, but again you won’t see the actual error outside of an error log.
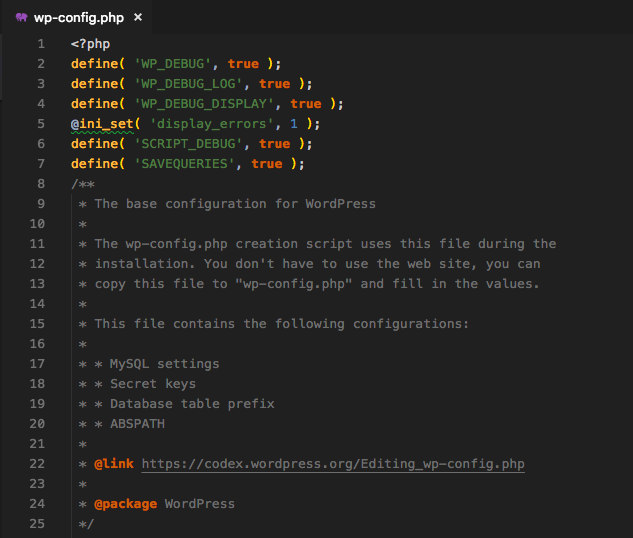
By default WordPress doesn’t display these errors to the user. You can adjust certain settings within wp-config.php to bring these errors to display and/or log them to a WordPress specific debug.log.
For many, modifying the wp-config.php file is a daunting task that in and of itself, can bring your site down. I’ve tried to simplify this with the creation of my WP Debugging plugin.
My plugin will add settings to wp-config.php. More specifically setting WP_DEBUG to true and setting WP_DEBUG_LOG to true. There are a number of additional settings that can also set to assist in debugging.
xDebug Isn’t the Only Way
Tom McFarlin has written extensively about coding and debugging.
In this member’s only post, Tom explains many of the individual settings that can assist in debugging a WordPress site using only native WordPress functions. These constants are also described in Debugging in WordPress.
Automate All the Things
WP Debugging is a plugin I wrote to automatically add many of WordPress’ built-in settings on plugin activation and remove them on plugin deactivation. The plugin uses the WP-CLI command to add and remove constants from the wp-config.php file. WP Debugging should be available in the Plugins Repository soon.
There are two optional plugin dependencies that request to be installed, Query Monitor by John Billion and Debug Bar. The notice for these dismisses for 45 days.
Query Monitor is an established development plugin that provides a wealth of information for debugging. Debug Bar is another excellent development plugin by Automattic.
Debug Quick Look by Andrew Norcross is a wonderful plugin whose sole function is to display the debug.log that WordPress writes debugging errors to when WP_DEBUG_LOG is set to true. I have included a modified version of this plugin.
Looking in the Logs
Viewing the debug.log will allow you to gain insight into the cause of the error. Often these errors will provide a stack trace pointing to exactly the file, function, or line of the error. They will definitely aid the developer.
Debugging is a art. One that you will only gain proficiency in through practice. It is my goal to help bring this information closer to you as simply as possible via the WP Debugging plugin.
You can read more about the specifics of what the WP Debugging plugin does on GitHub and, as always, PRs are happily considered on the develop branch.